Secrets of the Viz - Chromatics of the Force

.png)
.png)
Hi everyone, welcome to another episode of #SecretsOfTheViz ... that's usually how I start my podcast. I love chatting with folks on the podcast, and it's always a lot of fun (1 - 2 hours) yapping that I have to strategically cut into a digestible length (10 - 20 mins) for the community. I enjoy the work, because it is truly enlightening to hear the "ugly side" of the viz that nobody sees. Not to mention, I always learn so much and get inspired from my guests for my own projects too. So again, to all my past guests, a huge THANK YOU for indulging me and taking time in your busy schedule just to yap 😉
I thought about doing one for this viz and I'd thought I gathered enough experience after 65 episodes to fly solo. But something feels weird just talking to myself and getting excited about the topic, and perhaps it's something I need to eventually get used to? Writing isn't my strongest forte either (though I wrote a Sci-Fi short story for a school contest once... maybe I'll resurface that in a viz some day) but it's easier as it's kinda like a technical document of sorts.
So strap yourself in, it's gonna take 12 parsecs! (I'm assuming you get that reference 😅)
This viz was a long time coming, ever since I got inspired by George Koursaros' viz back in 2023. George uses a detailed map layering framework with trigonometry to curve those lines and put them in a circular fashion. If you haven't seen that amazing viz, I did chat with him on a podcast episode so check it out if you're interested.
But of course, I didn't have an actual idea until I made a trip to Disneyland's Galaxy Edge and honestly, it's every #StarWars fan's dream come true. Being able to come face to face with characters from the franchise, seeing the Millennium Falcon in actual scale, and the rides - was just galactically amazing. ⭐⭐⭐

But nothing beats making your own lightsaber in Savi's workshop. Words can't really express the joy screaming in my mind so I'll let the photos do the talking. It is truly every #StarWars fan's dream come true.


While I was building my lightsaber, the data nerd in me kept questioning - how many lightsabers were there, how many colors are there and who wielded them? Blame it on the curious mind of an analyst. And since I was by my lonesome self, what better way to make use of my ride queueing time than to start going down the data rabbit hole? The data fortunately wasn't too hard to find - most of which is in Wookieepedia , a Star Wars fandom wiki site. Plus, being a Star Wars fan - it was easy digesting all the information and strengthening some of my lore knowledge of one of my favorite franchises. It's a win-win no matter how I see it 😉
As I thought about how to represent that data, I kept going back to the workshop in my mind. I wanted to share that hands-on epic experience with everyone. I looked for inspiration and I came across this infographic done by CBR that showed the lightsaber's anatomy.

Of course, there's a risk of adding too much and losing your audience - especially when you think about how customizable a lightsaber truly is. There's circuits, hilts, blade types, aesthetic or symbolic features... but at the core of it is what gives the lightsaber the distinct hue we all recognize - The Kyber Crystal.

Everything clicked from that moment I decided to focus on the crystals. I wanted a way to show all of them and allow my audience to interact, and again my thought processes kept going back to replicating my experience at Disneyland. We were given a chance to choose our desired crystal at the start, and slot it in during our assembly phase. So I knew I needed to draw not just a lightsaber, but an exposed version so my audience can slot their crystals in. But whose lightsaber should I use? If you have watched any Star Wars content, Anakin Skywalker or better known as Darth Vader is kinda the central figure in the whole saga.

The whole franchise revolves around him balancing the force, standing between light and dark. That's the perfect catalyst for my design, I thought. So I took his lightsaber design, the very first one when he started his journey as as a young padawan because it was symbolic to how everything started. If you haven't noticed, I am a huge sucker for thematic designs :P But I digress. So moving into Figma, I started recreating the lightsaber (sans the beam) in step-by-step and adding gradient, shadow, details as I go. I'm not a true illustrator but I can copy to a certain extent 😅

Then I went on to create other elements of the design like the title, which imitates the movie title's typography and colors...

... and also a holographic emitter (or I hope it looked like one) as it it is one of the main communication methods in the franchise. Again, leaning heavily into the thematic design.

Now that the hard pieces (So I thought...) are done, it's time to build everything else in Tableau. Since I wanted to give some interactivity to my audience, I figured I'll reuse a technique from Ant Pulley that I've grown to love so much. Similar to how Ant does it (you can check out in detail on his blog post), I have a fairly simple dataset.
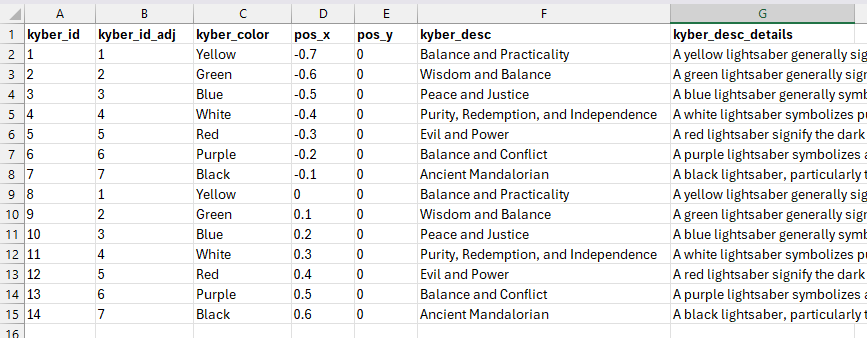
The main difference is you can see that I have duplicated Kyber crystals and this is because I wanted to create the illusion of infinite swiping instead of one-directional shown in Ant's version. The column pos_x gives it away, showing you how it'll appear on the x-axis. The other reason why I wanted an infinite view is also tied to me wanting a symmetrical design (i.e. 3 crystals on the left of the lightsaber, and 3 on the right)... again symbolizing the balance of the forces of light and dark. I prolly sound like a broken radio now on thematic design. Some people love it, some people hate it but it is a very core concept ingrained in my design style. 😅
The second dataset is prolly the most straightforward piece, which is just a list of all the lightsaber owners, and this is joined as a relationship to the first table on the kyber_color column.

Now the third dataset is where the magic happens for the lightsaber. If you've seen the viz, this is the starting blocks for getting the retract and extend animation. But I'll explain in a bit in the following sections.


The tricky thing about animations is you need to force a calculation change in Tableau, be it thru axis, values or even filters. Now, even though we had the pos_x column that denotes each kyber crystal's position on the x-axis, the view is not easily visible because the "camera" moves to the individual points when there's a change in selection. In order to make a scrolling effect, the camera view needs to be fixed at the centre point of the lightsaber, which in this case is the value 0 and whenever there's an user input, I need to shift the original x-axis of all the kyber crystals.
This is done through a parameter that is set when the user clicks on the crystal, and a nested calculated fields that uses that parameter to modify the position on the x-axis.

From there, we just need to create a map coordinate using MAKEPOINT and using the new adjusted x-value.

Add that into the canvas, add additional map layers if you want to add more details like how I added a "glowing" effect", which is essential a slightly bigger version of the crystal at a lower opacity. make sure you fix the axis so your "camera" doesn't move, only the marks move, and reduce the animation speed to maybe 1 or 2 seconds.

There's nothing too fancy going on for this as it's a INDEX() of all the lightsaber owners which is also quick filtered by the current selected kyber crystal. There's a trick in getting them arranged in an alternate up-down fashion, and it's using the modulo operator % and dividing by 2. This will return a 1 for odd indexes and 0 for even indexes, and you can use that to create that layout.

Now here's the juicy part you're really here for 😂

So the concept of how this works is fairly similar to the scrolling Kyber crystals. I am drawing lines that is either from 0 to 1 (if it's selected) or 0 to -1 (if it's not), creating the illusion of it retracting and reextending.

The calculation to get this to work is not overly complicated, and uses the densified path table we had earlier on. It uses 2 points from that table and sets it to either 1 or -1 depending on whether that crystal is selected. After that, it's just about stacking the sabers on top of one another, and putting a blank object with the same background color to hide the 0 points

As for the glow effects, I took a page out of Master of Maps, Dennis Kao's viz on NYC Condom Availability Program and built additional lines with increasing size and decreasing opacity.

And there you have it. It's a lot to cover in a blog post but hopefully this has been insightful for you. Let me know if you have further questions and if not...
.png)


.svg)
.png)

.png)


.png)